K-nearest neighbors (KNN) is one of the simplest Machine Learning algorithms. It is a supervised learning algorithm which can be used for both classification and regression.

KNN Model Representation :
The model representation for KNN is the entire training dataset. It is as simple as that.
KNN has no model other than storing the entire dataset, so there is no learning required. Efficient implementations can store the data using complex data structures like k-d trees to make look-up and matching of new patterns during prediction efficient.
Because the entire training dataset is stored, you may want to think carefully about the consistency of your training data. It might be a good idea to curate it, update it often as new data becomes available and remove erroneous and outlier data.
- Lazy Learning : No learning of the model is required and all of the work happens at the time a prediction is requested. As such, KNN is often referred to as a lazy learning algorithm.
- Nonparametric : KNN makes no assumptions about the functional form of the problem being solved. As such KNN is referred to as a nonparametric machine learning algorithm.
KNN can be used for regression and classification problems.
Making Predictions with KNN :
KNN makes predictions using the training dataset directly.
Predictions are made for a new data point by searching through the entire training set for the k most similar instances (the neighbors) and summarizing the output variable for those k instances.
- For regression this might be the mean output variable.
- For classification this might be the mode (or most common) class value.
Parameters :
- Distance measure
- Not all distances are Euclidean.
- Notion of similarity and distance.
- Value of K
- Some “K”s are better than other.
- Too small? Too large?
Distance metrics :
To determine which of the k instances in the training dataset are most similar to a new
input, a distance measure is used.
There are various options available for distance metric such as euclidean or Manhattan distance. The most commonly used metric is euclidean distance.

- Euclidean Distance : Calculated as the square root of the sum of the squared differences between a point a and point b across all input attributes i.
- Hamming Distance: Calculate the distance between binary vectors.
- Manhattan Distance: Calculate the distance between real vectors using the sum of their absolute difference. Also called City Block Distance.
- Minkowski Distance: Generalization of Euclidean and Manhattan distance.
You can choose the best distance metric based on the properties of your data.
Euclidean is a good distance measure to use if the input variables are similar in type (e.g.
all measured widths and heights).
Manhattan distance is a good measure to use if the input variables are not similar in type (such as age, gender, height, etc.).
Tuning the hyper-parameter K :
The value for k can be found by algorithm tuning.
A small value of k means that noise will have a higher influence on the result and large value make the algorithm computationally expensive.
It is a good idea to try many different values for k (e.g. values from 1 to 21) and see what works best for your problem. The computational complexity of KNN increases with the size of the training dataset.
Usually, we perform cross-validation to find out best k value (or to choose the value of k that best suits our accuracy / speed trade-off).
If you don’t want to try multiple values of k, a rule of thumb is to set k equal to the square root of total number of data points. For more on choosing best value of k, refer this stackoverflow thread.
KNN for Regression :
When KNN is used for regression problems the prediction is based on the mean or the median of the k-most similar instances.
KNN for Classification :
When KNN is used for classification, the output can be calculated as the class with the highest frequency from the k-most similar instances. Each instance in essence votes for their class and the class with the most votes is taken as the prediction.
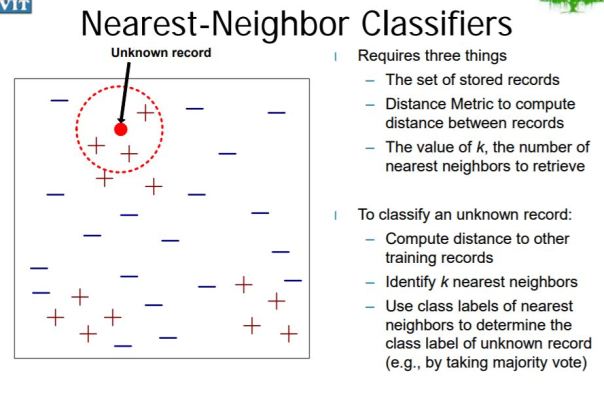
Understanding the classification algorithm (illustration) :
Let us understand this algorithm with a classification problem. For simplicity of visualization, we’ll assume that our input data is 2 dimensional. We have two possible classes – green and red.
Lets plot out training data in feature space.

There is no explicit training phase in KNN! In other words, for classifying new data points, we’ll directly use our dataset (in some sense, the dataset is the model).
To classify a new data point, we find the k points in the training data closest to it, and make a prediction based on whichever class is most common among these k points (i.e. we simulate a vote). Here closest is defined by a suitable distance metric such as euclidean distance. Other distance metrics are discussed below.
For example, if we want to classify blue point as shown in following figure, we consider k nearest data points and we assign the class which has the majority.

If k = 3, we get two data points with green class and one data point with red class. Hence, we’ll predict green class for the new point.

Here’s another example, let us change the position of new point (blue point) as shown below.

If we take k = 5 then we get four neighbors with red class and one neighbor with green class. Hence, new point will be classified as red point.

If you are using k and you have an even number of classes (e.g. 2) it is a good idea to choose a k value with an odd number to avoid a tie. And the inverse, use an even number for k when you have an odd number of classes. Ties can be broken consistently by expanding k by 1 and looking at the class of the next most similar instance in the training dataset.
Curse of Dimensionality :
KNN works well with a small number of input variables (p), but struggles when the number of inputs(features) is very large. Each input variable can be considered a dimension of a p-dimensional input space.
For example, if you had two input variables X1 and X2, the input space would be 2-dimensional. As the number of dimensions increases the volume of the input space increases at an exponential rate. In high dimensions, points that may be similar may have very large distances. All points will be far away from each other and our intuition for distances in simple 2 and 3-dimensional spaces breaks down. This might feel unintuitive at first, but this general problem is called the Curse of Dimensionality.
Preparing Data For KNN :
- Re-scale Data: KNN performs much better if all of the data has the same scale. Normalizing your data to the range between 0 and 1 is a good idea. It may also be a good idea to standardize your data if it has a Gaussian distribution.
- Address Missing Data: Missing data will mean that the distance between samples
cannot be calculated. These samples could be excluded or the missing values could be imputed. - Lower Dimensionality: KNN is suited for lower dimensional data. You can try it on
high dimensional data (hundreds or thousands of input variables) but be aware that it may not perform as well as other techniques. KNN can benefit from feature selection that reduces the dimensionality of the input feature space.
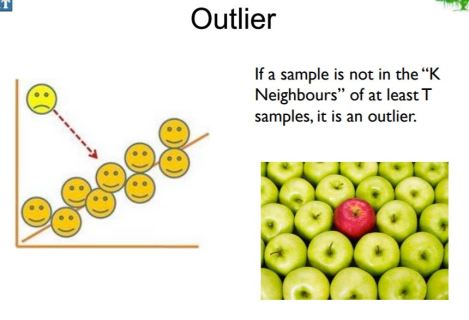
Outliers :
- KNN stores the entire training dataset which it uses as its representation.
- KNN does not learn any model.
- KNN makes predictions just-in-time by calculating the similarity between an input sample and each training instance.
- There are many distance measures to choose from to match the structure of your input data.
- That it is a good idea to re-scale your data, such as using normalization, when using KNN.
Advantages :
- KNN is Simple
- KNNs are good if there are many many classes. (Can be used for multi-class classification problems)
- No loss in information (everything is remembered). Fast to Train (no training?).
Disadvantages :
- High cost for classification/inference
- Work “only” at the inference/test time
- Carry examples (implication of memory)
- Uses all features/attributes:
- Do not learn which features are important
- Can be fooled easily with irrelevant features
The biggest use case of k-NN search might be Recommender Systems. If you know a user likes a particular item, then you can recommend similar items for them. To find similar items, you compare the set of users who like each item—if a similar set of users like two different items, then the items themselves are probably similar!
- This applies to recommending products, recommending media to consume, or even ‘recommending’ advertisements to display to a user!
https://www.quora.com/What-are-industry-applications-of-the-K-nearest-neighbor-algorithm
